


At A Glance
- After robust performance during the first eleven months of a presidential election year, the markets have pulled back from early December. While the headline indexes, which are largely driven by large-cap tech and AI stocks, have dipped slightly, there has been more damage under the hood with equal weight and small-cap indexes.
- As President Trump assumed office on January 20th, there is significant uncertainty about a number of tax and economic policies and their potential impact on the economy and the markets. We would like to remind you that this is true with every new administration.
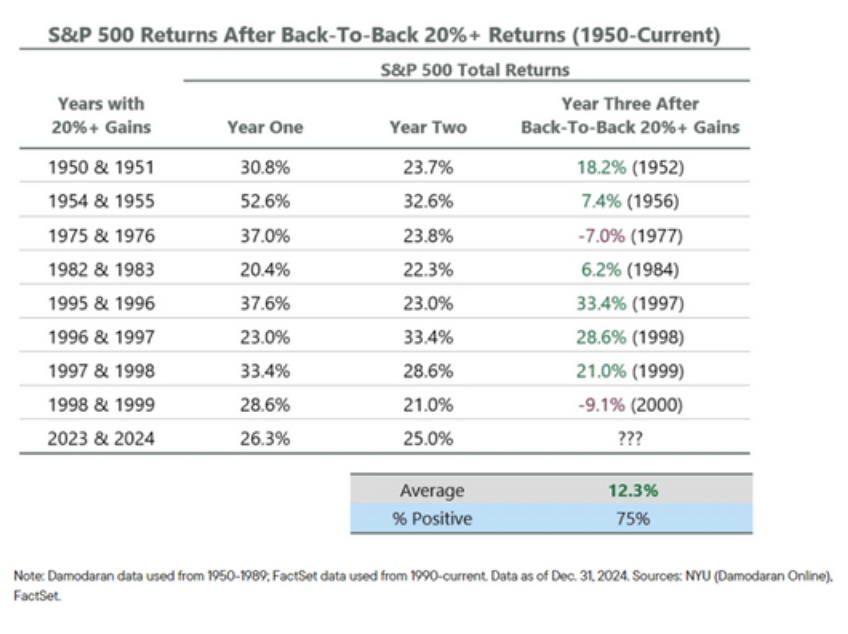
- We have now experienced back-to-back years of 20% plus returns in the S&P 500 index. This leads many people to believe the markets are due for a downturn. However, while we expect more volatility in the upcoming year, history shows a more optimistic set of outcomes, which we will explore below.
- The Fed has its work cut out for it in the coming year as long-term interest rates continue to rise even as the central bank has cut short-term rates by 1% since September.
- Predictions for the market from the major banks and brokerage companies for the coming year show a wide range of dispersion. Maintaining disciplined diversification while managing liquidity and risk has historically proven to be a prudent strategy during times of uncertainty.'
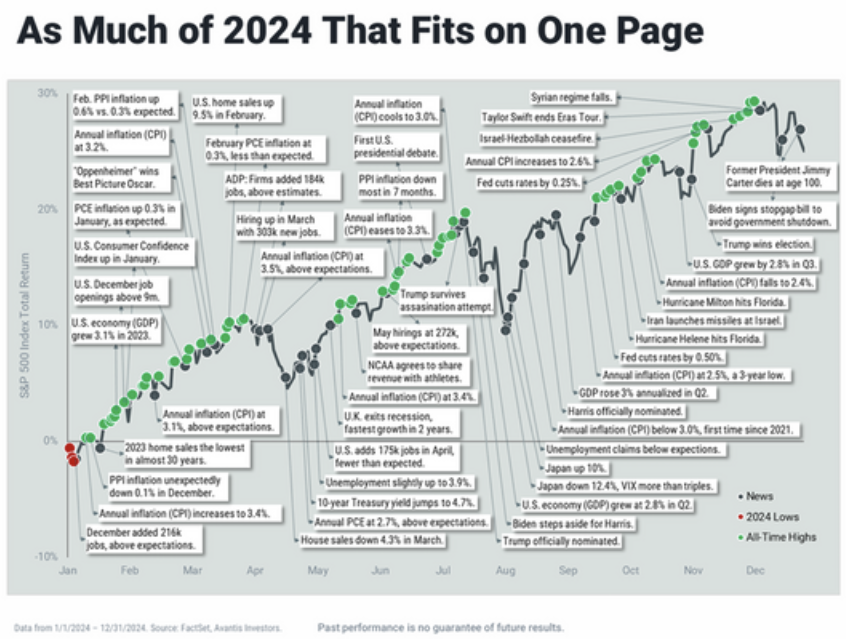
The Investment Committee met on the afternoon of Monday, January 13th, in the afternoon to continue evaluating the investment and economic landscape as we enter the new year. As President Trump assumed office on January 20th, there is significant uncertainty about a number of tax and economic policies and their potential impact on the economy and the markets. This is true of every new administration. It also creates a lot of news and noise in the headlines, leading to many questions and concerns among clients and investors. We want to remind you that this is not a new phenomenon. In today's world of 24-hour cable news and social media, there is continual pressure to put out new headlines that generate clicks and readers. To help illustrate this, we have included a chart below that shows just a sampling of headlines over the last 12 months that could have driven both markets and investor psychology. |
|
Since the S&P 500 index ended 2024 with a gain of more than 20%, it seems that ignoring the headline du jour and not interrupting the compounding of your portfolio was a wise strategy. We believe this will continue to be true going forward. We have now experienced back-to-back years of 20% plus returns in the S&P 500 index. This leads many investors to believe the markets are due for a downturn. While we expect more volatility in the upcoming year, history provides a more optimistic set of outcomes, which is shown in the chart below. As you can see, since 1950, when the market has experienced back-to-back returns of 20%+, it has had more moderate but still positive returns approximately 75% of the time the following year. While this is no guarantee, history can provide some context for the future. |
|
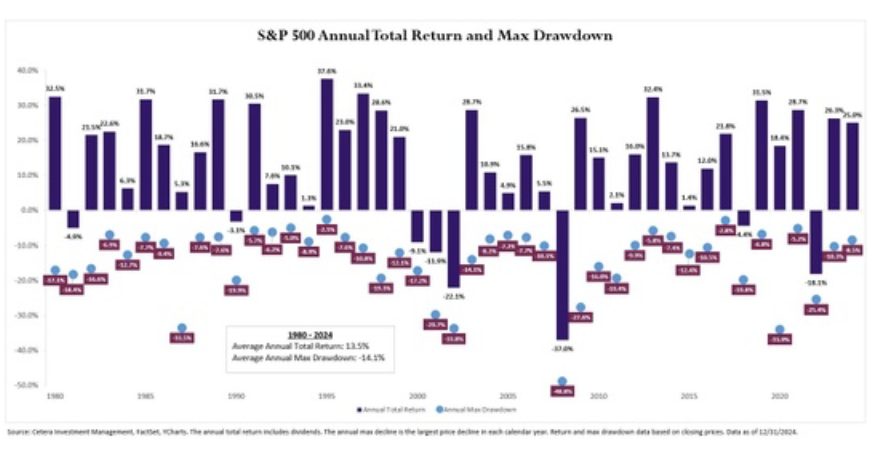
After notching the best 11-month return during a presidential election year since 1940, the markets have pulled back recently. While the headline indexes, which have been driven mainly by large-cap tech and AI stocks, have dipped slightly, there has been more damage under the hood with equal-weight and small-cap indexes. Since the market peak in early December, the equal-weight S&P 500 index has dropped nearly 8%, while small-cap indexes have dropped double digits. The Fed will have its work cut out for it in the coming year as long-term interest rates continue to rise, even as the central bank has cut short-term rates by 1% since September. This means that each inflation and unemployment report going forward will be scrutinized more closely. I know that we have shared our final chart below with you in the past. However, it is a helpful reminder that staying the course with the age and risk profile appropriate portfolio your advisor has constructed to help you meet your long-term goals has paid off over time. Volatility is normal, even in bull markets. Since 1980, the S&P 500 has had an average calendar-year total return of 13.5%, with gains in 37 of 45 years, despite an average intra-year drawdown of -14.1%. It’s a classic case of “no pain, no gain.” |
|
Final ThoughtsPredictions for the market from the major banks and brokerage companies for the coming year show a wide range of dispersion. Maintaining disciplined diversification while managing liquidity and risk has historically proven to be a prudent strategy during times of uncertainty. Please remember that being diversified means you will never have too many of your eggs in the basket going up at any point in time. However, you will never have all of your eggs in the basket going down at any point in time. This means that we exchange “never making a killing” in the market for " never getting killed” in the market. The investment committee appreciates your continued trust and confidence in our process. Please feel free to share this newsletter with your friends and loved ones, and remember that we are here to help them if they have questions or concerns. We would love to have the opportunity to help them as we continue helping you. Thanks, and have a great day. Should you have any questions regarding these notes, please do not hesitate to contact Kevin at (678) 401-6102. |
Investment Committee Members
|
The views stated in this piece are not necessarily the opinion of Cetera Advisors LLC and should not be construed directly or indirectly as an offer to buy or sell any securities. Due to volatility within the markets mentioned, opinions are subject to change without notice. Information is based on sources believed to be reliable; however, their accuracy or completeness cannot be guaranteed.
Past performance does not guarantee future results. Additional risks are associated with international investing, such as currency fluctuations, political and economic stability, and differences in accounting standards. Investors cannot invest directly in indexes. The performance of any index is not indicative of the performance of any investment and does not take into account the effects of inflation and the fees and expenses associated with investing. Additional risks are associated with international investing, such as currency fluctuations, political and economic stability, and differences in accounting standards.
Investors cannot invest directly in indexes. The performance of any index is not indicative of the performance of any investment and does not take into account the effects of inflation and the fees and expenses associated with investing. A diversified portfolio does not assure a profit or protect against loss in a declining market.
A diversified portfolio does not assure a profit or protect against loss in a declining market.
Re-balancing may be a taxable event. Before you take any specific action be sure to consult with your tax professional.
The Russell 2000 Index measures the performance of the small-cap segment of the U.S. equity universe and is a subset of the Russell 3000 Index representing approximately 10% of the total market capitalization of that index. It includes approximately 2000 of the smallest securities based on a combination of their market cap and current index membership.
The CBOE Volatility Index (VIX) is a key measure of market expectations of near-term volatility conveyed by S&P 500 stock index option prices.
The Bloomberg U.S. Aggregate Total Return Value Unhedged Index, also known as ‘Bloomberg U.S. Aggregate Bond Index’ formerly known as the ‘Barclays Capital U.S. Aggregate Bond Index’, and prior to that, ‘Lehman Aggregate Bond Index’, is a broad-based flagship benchmark that measures the investment grade, U.S. dollar-denominated, fixed-rate taxable bond market. The index includes Treasuries, government-related and corporate securities, MBS (agency fixed-rate pass-throughs), ABS and CMBS (agency and non-agency).