
At A Glance
- As we finally head into the home stretch of campaign season, we thought it would be helpful to remind you once again that elections have not significantly affected markets historically. Often, market performance during various Presidential administrations would likely surprise most investors.
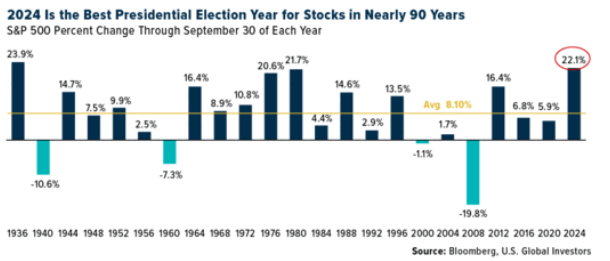
- Despite the bitter and partisan rhetoric we hear about how the election will impact the economy, the stock market has experienced its best nine months of a Presidential election year in decades.
- Economic reports over the last month have supported the Federal Reserve Bank narrative that inflation is continuing to moderate without causing significant damage to the economy or employment.
- As the committee met on the one-year anniversary of Hamas’ brutal invasion of Israel, we need to remain cognizant of geopolitical events and their potential to move markets in the short run.
- To that end, with markets near all-time highs, we continue to recommend raising cash for any short-term liquidity needs and rebalancing your portfolio regularly to help keep your portfolio allocation in line with your risk profile and investment objectives.
The Investment Committee met on the afternoon of Monday, October 7th, to review and discuss the most recent investment and economic commentary from the market strategists we follow. With election season entering its last few weeks and geopolitical uncertainty in multiple locations around the globe, recent economic data has been unexpectedly strong and helped move US stock markets toward all-time highs. If you turn on the television, you can't help but be deluged by ongoing campaign commercials. This political season has been harsh on rhetoric and charges from candidates on both sides of the aisle. Our committee has tried to remind our clients that, by and large, outcomes of Presidential and Congressional elections do not often move the needle significantly for the markets. To help cement that thought process, we would like to share the following chart showing the annualized total returns of the markets during our last eight Presidents. |
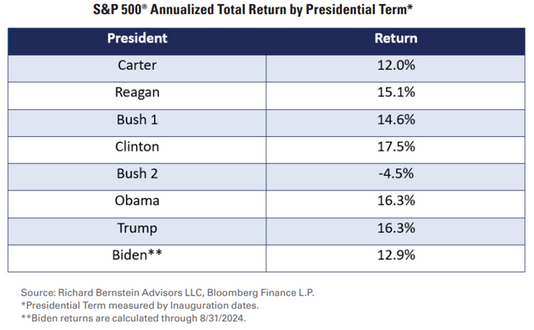 |
We want to thank our friends at Richard Bernstein Advisors (RBA) for the above chart. You will likely note that the stock market had double-digit returns for all the presidents in the chart except for George W Bush, who got to endure both the dot.com/9/11 downturn and the subprime mortgage crisis. Even Jimmy Carter, who recently celebrated his 100th birthday and is generally much maligned for his economic performance, saw the stock market return 12% a year during his administration. RBA also astutely pointed out that gold was the best-performing asset class under Carter (Democrat) and Bush 43 (Republican). Commodities were the best performer under Biden (Democrat) but the worst under Obama (Democrat) and Trump (Republican), and stocks were the best performer under Reagan (Republican), Clinton (Democrat), Obama (Democrat), and Trump (Republican). Stocks were either the best or second-best performing asset class during six of the past eight Presidents’ time in office. Many investors would be surprised to learn that despite the bitter and partisan rhetoric we hear about how the election will impact the economy, the stock market has experienced its best nine months of a presidential election year in nearly 90 years, as you can see in our second chart below. |
 |
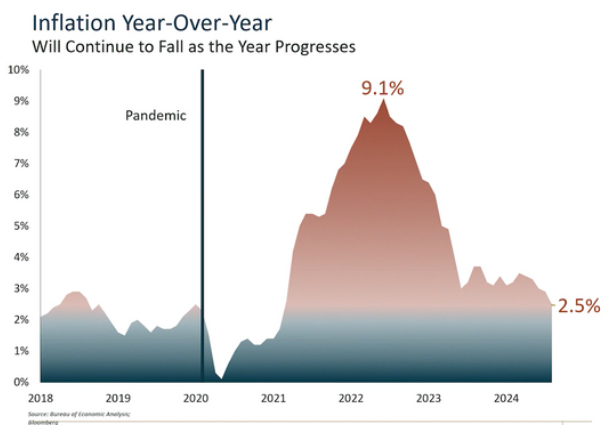
Economic reports over the last month have supported the Federal Reserve Bank's narrative that inflation is continuing to moderate without causing significant damage to the economy or employment. Both the CPI and PCE measures of inflation continue to moderate under 3%, giving the Fed more confidence to begin cutting interest rates. They started this interest rate decrease campaign with a 1/2% rate cut in September. This was their first interest rate cut since March 2020, during the early days of the COVID-19 pandemic. |
 |
Final ThoughtsAfter a disappointing unemployment report in early August caused many to fear that the Fed had waited too long to begin cutting interest rates, job growth picked up, and the unemployment rate unexpectedly fell with September and October reports. The most recent report, released on October 4th, showed that the economy created 254,000 jobs. There were also upward revisions to the previous two months' reports and an upward revision to GDP growth, which seemed to show the economy on firmer footing than previously believed. As the committee met on October 7th, the one-year anniversary of Hamas’ brutal invasion of Israel, we would be remiss not to acknowledge that there is significant geopolitical uncertainty and hot spots across the globe. As we learned on 9/11, these incidents can lead to short-term market volatility. However, when these unfortunate events occur, they often kick economic activity and the military-industrial complex into high gear, historically supporting economic growth. With markets near all-time highs, we continue to recommend raising cash for any short-term liquidity needs and rebalancing your portfolio regularly to help keep your portfolio allocation in line with your risk profile and investment objectives. These two activities will help you manage risk and maintain a proper perspective during the inevitable ups and downs of the markets. Should you have any questions regarding these notes, please do not hesitate to contact Kevin at (678) 401-6102. We are here for you as we are all anxious to put political and campaign ads in the rearview mirror. |
Investment Committee Members
|
The views stated in this piece are not necessarily the opinion of Cetera Advisors LLC and should not be construed directly or indirectly as an offer to buy or sell any securities. Due to volatility within the markets mentioned, opinions are subject to change without notice. Information is based on sources believed to be reliable; however, their accuracy or completeness cannot be guaranteed.
Past performance does not guarantee future results. Additional risks are associated with international investing, such as currency fluctuations, political and economic stability, and differences in accounting standards. Investors cannot invest directly in indexes. The performance of any index is not indicative of the performance of any investment and does not take into account the effects of inflation and the fees and expenses associated with investing. Additional risks are associated with international investing, such as currency fluctuations, political and economic stability, and differences in accounting standards.
Investors cannot invest directly in indexes. The performance of any index is not indicative of the performance of any investment and does not take into account the effects of inflation and the fees and expenses associated with investing.
A diversified portfolio does not assure a profit or protect against loss in a declining market.
Re-balancing may be a taxable event. Before you take any specific action be sure to consult with your tax professional.
The Russell 2000 Index measures the performance of the small-cap segment of the U.S. equity universe and is a subset of the Russell 3000 Index representing approximately 10% of the total market capitalization of that index. It includes approximately 2000 of the smallest securities based on a combination of their market cap and current index membership.
The CBOE Volatility Index (VIX) is a key measure of market expectations of near-term volatility conveyed by S&P 500 stock index option prices.
The Bloomberg U.S. Aggregate Total Return Value Unhedged Index, also known as ‘Bloomberg U.S. Aggregate Bond Index’ formerly known as the ‘Barclays Capital U.S. Aggregate Bond Index’, and prior to that, ‘Lehman Aggregate Bond Index’, is a broad-based flagship benchmark that measures the investment grade, U.S. dollar-denominated, fixed-rate taxable bond market. The index includes Treasuries, government-related and corporate securities, MBS (agency fixed-rate pass-throughs), ABS and CMBS (agency and non-agency).